The simulation
Once a regulatory model has been defined, a simulation can be launched through the Run Simulation option of the Action menu. This option triggers a dialog box allowing to choose simulation settings.
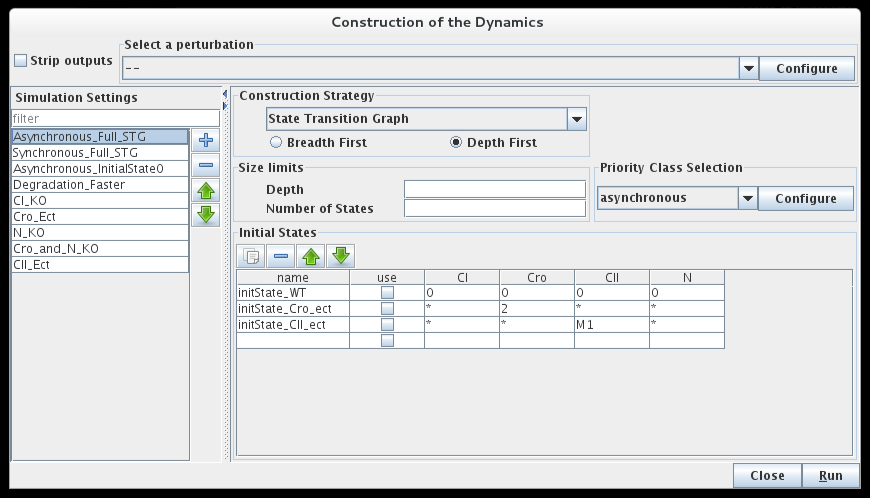
This dialog box allows to define simulation settings. The top part of the dialog box enables the definition of transformations to apply to the regulatory graph before the simulation. The left part of the dialog box enables to manage (select, add or remove) simulations settings. The right part of the dialog box enables the definition of the current simulation setting.
Configure the simulation
The top part of the simulation dialog enables the selection of a perturbation to be applied to the regulatory graph before running the simulation. The associated Configure button will show the perturbation definition panel.
The bottom part of the dialog box is dedicated to the definition of the initial states of the simulation. Each row defines a single state or a group of states, and the checkboxes allow to select the states used for the simulation. If no row is selected, all possible states are considered, generating a complete state transition graph.
In a given state of the system, one or several genes are called to update their values. When several changes are pending, different construction strategies lead to different successor states and thus to different state transition graphs. GINsim implements the classical synchronous and asynchronous updating, and enables the definition of ad hoc strategies using priority classes. These updating modes are described in detail in their documentation.
Running simulations with perturbation
Mutant simulation result
The "strip output" checkbox next to the perturbation selector enables to activate automatic removal of all output components from the simulation. Their value can be retrieved on demand when browsing the resulting State Transition Graph. See the reduction section for more details.
The "Construction Strategy" panel enables the selection of the type of graph computed by the simulation (the classical State Transition Graph, i or the more compact Hierarchical Transition Graph).
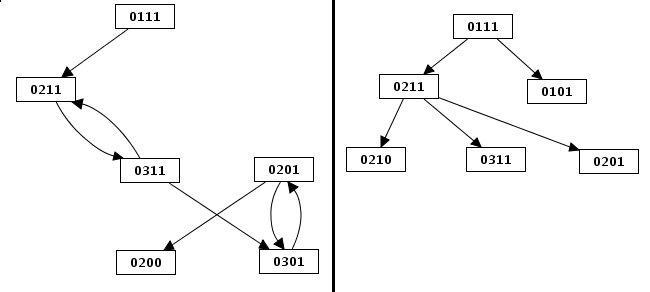
State Transition Graphs can be computed breadth-first or depth-first. Both options lead to the same result, unless the simulation is interrupted by a size limit (see below).
Depth and size limitations
An option is also offered to limit the search depth and/or the total number of states generated in a simulation.
When considering several initial states (or the full STG), some of them can be reached while running the simulation from an other state. In this case, no new search will be triggered for them and the depth counter will not be reinitialised (i.e. the depth limit for these initial states will be shorter).
The limit on the total number of states apply to all simulation modes. Under the asynchronous assumption, this limit has slightly different effects on depth first and breadth first search.
Limitation of the size (depth first and breadth first search construction)
Running the simulation
While the simulation is running, the bottom left corner indicates the size of the generated state transition graph. The simulation can be interrupted, using the Cancel button, without loosing the calculated part of the state transition graph.
At the end of a simulation, several options are available to save, display or analyse the resulting state transition graph (see Processing a new graph).