Analysis of a State Transition Graph
- Tutorial
- Definition of a Logical Regulatory Graph
- Running a simulation
- Analysis of a State Transition Graph
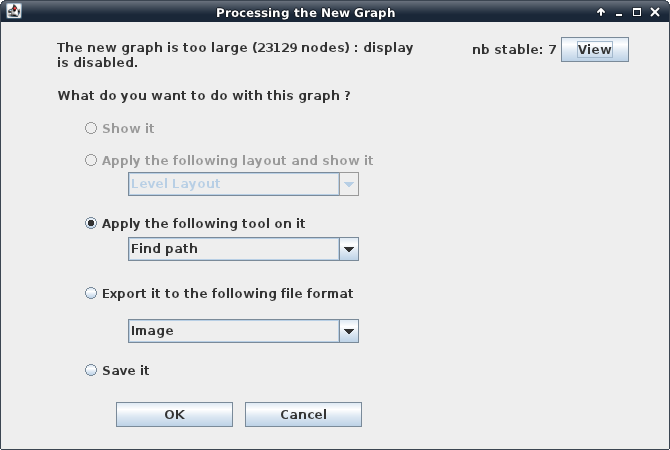
Processing the new graph
At the end of the simulation, a dialog box provides some informations on the generated state transition graph: size (number of states) and number of stable states. By default, GINsim proposes to save or display the graph, but the user can also run different analysis on it.
Analysis tools
Strongly connected component
GINsim enables the identification of the graph of the Strongly Connected Components (SCC graph, see http://en.wikipedia.org/wiki/Strongly_connected_component) of an existing graph. The SCC graph is an acyclic graph based on the original one: each node of the SCC graph is a cycle or a set of intertwined cycles of the original graph. To compute this graph, use the "SCC graph" action in the "Actions" menu.
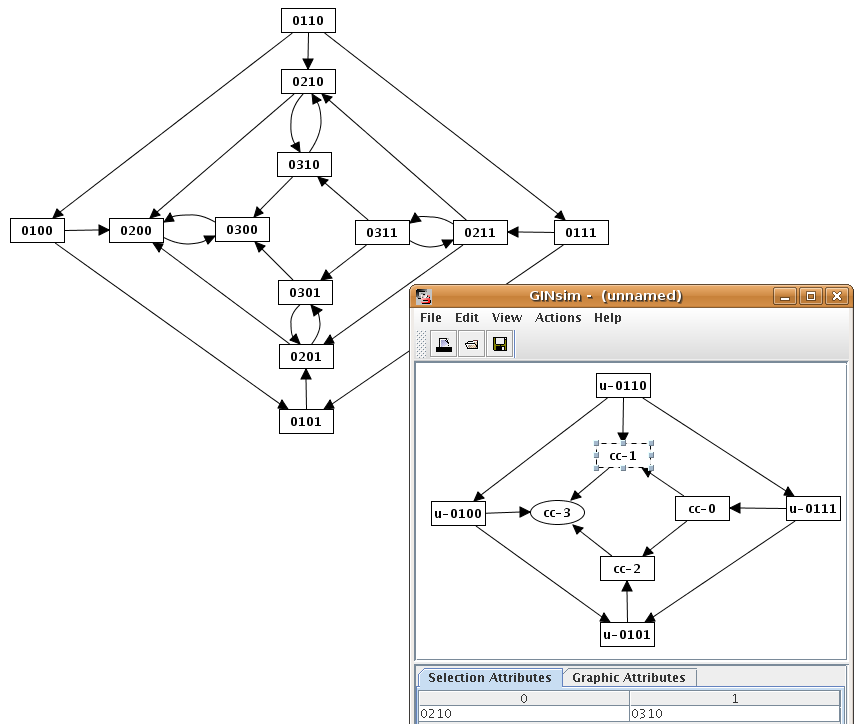
While displaying a SCC graph, the "selection attribute" tab in the bottom panel shows the content of the selected component (i.e. the list of corresponding nodes in the original graph).
Path finder
The "search path" action allows to find a path between different states of the state transition graph. Selecting the "search a path" action in the action menu opens the configuration dialog. This dialog allows to specify the starting state, the target state , and intermediate states (using the "+" and "X" buttons to add/remove them). GINsim then performs a shortest path search (If several paths exist between these states, the result is thus the first encountered shortest path).

The animation tool allows to select a path interactively. It highlights genes of the regulatory graph according to the selected state.