Highlight local graph
Motivation
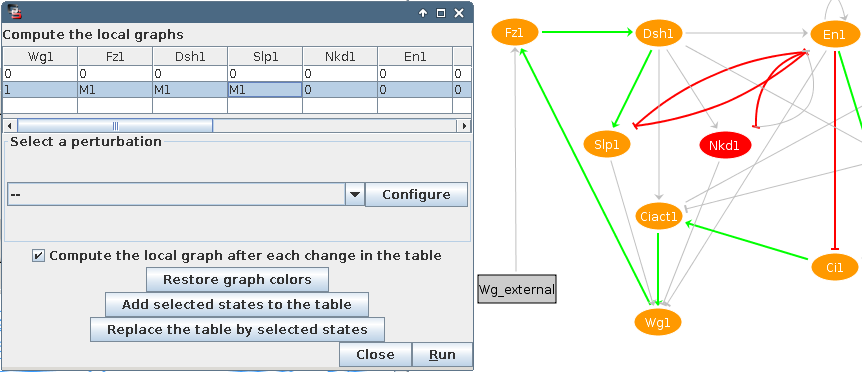
The local graph is a subgraph of the full LRG encompassing only the interactions which are active in the neighbourhood of one specific state. See Remy2008 for a more formal definition. The highlight local graph tool determines these active interactions and highlights them in the graph view.
Usage
The Highlight local graph entry on the Graph menu opens the local graph computation dialog. This dialog provides an interface divided into three main sections:
The state definition table, where the user can specify the value of each component defining a (set of) state(s).
The perturbation selection, where the user can select (and define new) perturbations.
The execution options, where the user can specify if for every change in the table the local graph should be automatically updated, and restore the original graph colors if needed.
After running this tool, the logical regulatory graph interactions will change colour depending on their activation type. Their colour code representation will be: green, for interactions having an activatory effect; red, for interactions with an inhibitory effect; and grey, for interactions without an effect.
When selecting this tool for a state transition graph, it will open the associated regulatory graph and offer additional options in the dialog box, allowing to use the selected states.
Availability
Highlight local graph was implemented in GINsim 3.0.
